
Background
For this project, I will be using the California Safe Cosmetics Program (CSCP) dataset from the California Department of Public Health. This is a dataset intended for public access/use and can be found here.
The CSCP’s aim is to compile a list of cosmetic products that contain hazardous ingredients known/suspected of causing cancer, birth defects, or developmental and reproductive harm. The California Safe Cosmetics Act (2005) and Cosmetic Fragrance Ingredient Right to Know Act (2020) require that all harmful ingredients listed on labels must be reported to the California Department of Public Health to be compiled into a list for public disclosure.
This article is Part I of a two part series. Part I discusses the creation of business rules and an entity relationship diagram for the CSCP dataset. Part II focuses on building the relational database.
If you are interested in following along with my process, check out my CSCP GitHub repository for metadata, raw data, cleaned tables and more.
Metadata Analysis
The first step in analysis projects is to familiarize yourself with your data. Understanding the dataset’s structures, relationships, and incomplete data are necessary components when prepping for analysis.
So, where do you even start? There is no right or wrong way to begin this process. My preference is to dive into the metadata to see if there are consistent labeling structures and relationships among unique entities.
A quick look at the metadata shows us that there are 22 attributes in this dataset, some of which consist of hierarchies such as category and subcategory. All attributes describe different aspects of the reported cosmetic products, so no consolidation of attributes is necessary.
At the bottom of the file there is a comment from the authors about the primary key: “These fields together are the unique identifier for an individual product/chemical profile: CDPHId, CSFId, SubCategoryId, ChemicalId.”
That’s a very complicated primary key! Identifying unique products requires four separate attributes!
Next step was to open up the raw data file and check the primary key attributes. As a rule, primary keys can’t have null fields because they would be unable to differentiate one identifier from another.
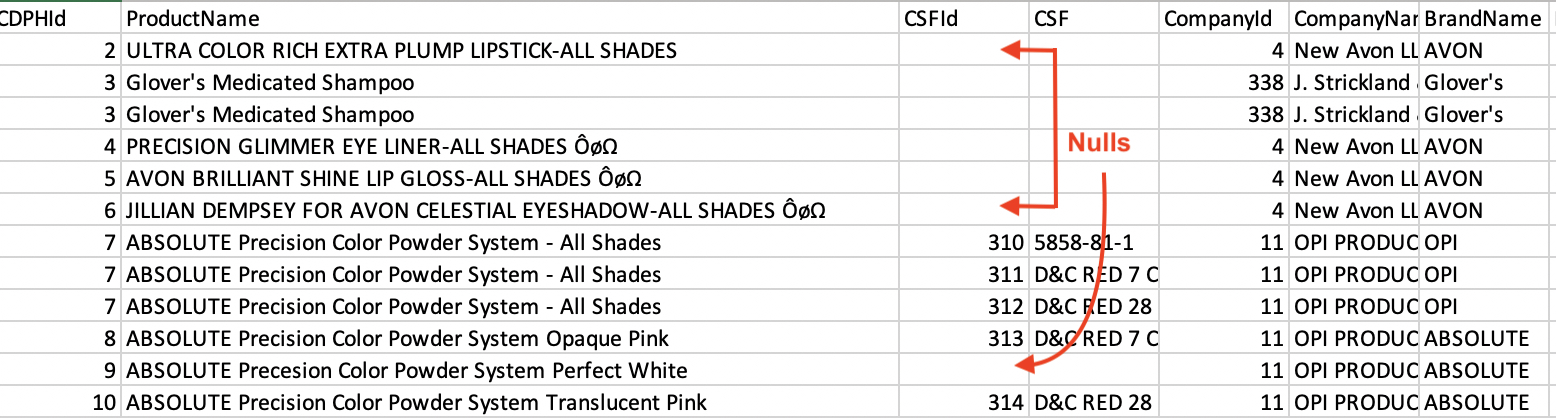 Uh oh, turns out the CSFId attribute has nulls…
Why are there nulls in the CSFId attribute? We can look through the metadata definitions again to figure out why some products have CSFId nulls. CSFId is an indicator for products with variations of color, scent, and taste. If a product has only one formulation, then the primary key will only consist of CDPHId, SubCategoryId, and ChemicalId attributes.
So, the TLDR version of this metadata analysis:
- The dataset has a complex primary key consisting of four attributes.
- The primary key component CSFId has nulls.
These observations indicate that the CSCP dataset is ineffective as a spreadsheet due to the complexity of searching for unique products. Converting the CSCP dataset into a relational database would improve the efficiency and robustness of downstream analysis.
Business Rules
Before converting a spreadsheet into a relational database, business rules need to be developed using the metadata definitions file.
The first step is to identify the entities, or real objects that are distinct from one another.
Distinct entities in the CSCP data include:
- Company
- Product
- Primary Category
- Subcategory
- Variant
- Chemical
The next step is to write the business rules on how the products are related to the other entities. There are three types of entity relationships: one-to-one (1:1), one-to-many (1:M), and many-to-many (M:N).
Here is the list of business rules that I created for the CSCP data:
- A company can have many products. A product has one company. (1:M)
- A product can have only one primary category. A primary category can have many products. (1:M)
- A product can only have one subcategory. A subcategory can have many products. (1:M)
- A subcategory product can have many variants- colors/scents/flavors (1:M)
- A subcategory product can have many chemicals. Chemicals can be in many subcategory products. (M:N)
- A product variant can have many chemicals. Chemicals can be in many products. (M:N)
Entity Relationship Diagram (ERD)
The last step before you can start building your relational database is to create an entity relationship diagram. Entity relationship diagrams (ERD) are graphical depictions of the relationships between distinct entities.
The six entities identified in the business rules step become the tables of the ERD (Company, Product, Primary Category, Subcategory, Variant, and Chemical). Attributes not designated as distinct entities were distributed to associated tables. CompanyName, for example, was placed in the ‘Company’ entity table.
Business rules five and six, which describe M:N relationships, indicate the need for two additional tables that describe chemicals for product variants and product subcategories. These bridge tables simplify M:N relationships into 1:M to avoid double counting in the database.
Below is the entity relationship diagram (ERD) that was created using dbdiagram.io. This diagram maps out the relationships between CSCP entities using the crow’s foot notation. Primary keys (bolded) are connected to their matching foreign keys in adjacent tables.
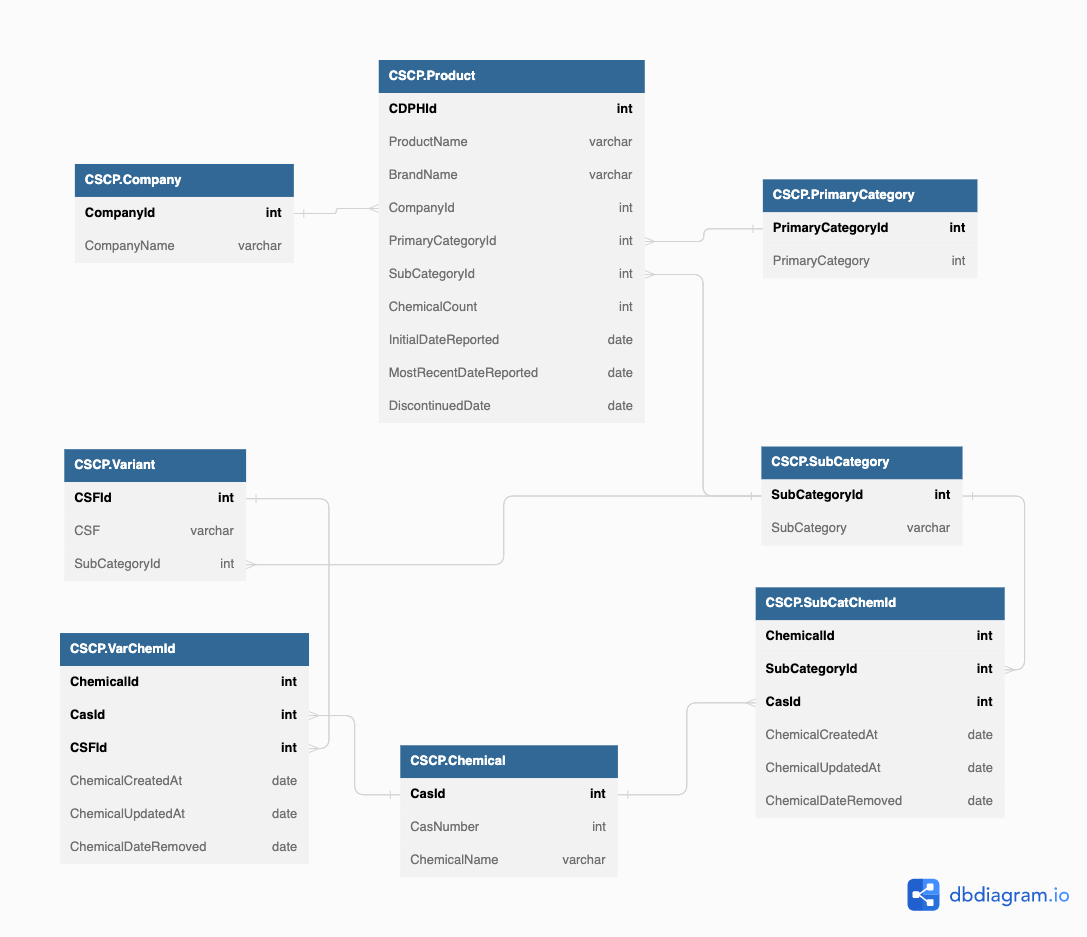
Pretty cool, right? Now that we understand the relationships between entities in the CSCP data, we can start building the tables for the relational database (see Part II).